Where the techniques of Maths
are explained in simple terms.
Statistics - Box (and Whisker) plots.
Test Yourself 1.
- Algebra & Number
- Calculus
- Financial Maths
- Functions & Quadratics
- Geometry
- Measurement
- Networks & Graphs
- Probability & Statistics
- Trigonometry
- Maths & beyond
- Index
| 5 figure summary | 1. Determine the 5 figure summary for the following data set of 9 observations:
3, 5, 7, 2, 6, 3, 4, 6, 7. Answer.[2, 3, 5, 6.5,7]. |
| 2. Determine the 5 figure summary for the following data set:
1, 1, 2, 5, 7, 9, 10, 10, 11, 11, 12, 13. Answer.[1, 3.5, 9.5, 11, 13]. |
|
| 3. The five figure summary for a data set is:
[2, 3, 7, 11, 12] Which of the following data sets could have been used to create the above summary? Answer.(a). |
|
| 4. In a five-number summary of the following data set, what is the entry indicating the upper quartile
20, 22, 25, 28,36, 40, 40, 42, 46 |
|
| Drawing from a 5 figure summary. | 5. Draw a box plot from the following 5 figure summary:
[1, 4, 6, 11, 14]. |
| 6. Draw a box and whisker plot from the following 5 figure summary:
|
|
| Drawing from a data set. | 7. A data set is 1, 3, 4, 4, 4, 5, 6, 6, 7, 8, 9.
Answer.(i) [2, 4, 5, 7, 9]. |
8. A data set is 25, 15, 17, 10, 18, 19, 12, 17, 18, 14.
Answer.(i) [10, 14, 17, 18, 25]. |
|
| 9. | |
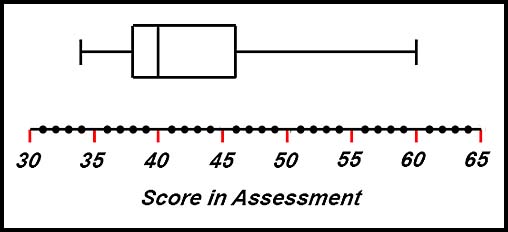
| Interpreting a single plot. | 10. The following box plot summarises the results of an assessment given to 120 students.
Which of the following statements are correct? Give a reason to support your answer. Answer.(i) Correct the median is 40 as shown by the vertical line inside the box. (ii) Incorrect - 46 marks (Q3) is where 75% of students are accounted for. So the number up to 46 is 90 students. (iii) Incorrect - 120 students (all) scored 34 or more. (iv) Correct - half the 120 students (60) scored at the median (40) or more. (v) Incorrect - 25% of students (30) scored 46 or more while 50% of students (50) scored 38 to 46 (which is the inter-quartile range). |
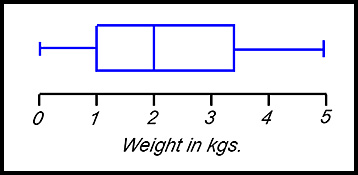
| 11. A local Post Office handled 12,000 small parcels in one week. Small parcels are defined as being less than 5 kg. The box and whisker plot below summarises the weights of these parcels.
How many of the parcels handled by this Post Office in that week weighed between 1.0 kg and 2 kgs? Answer.25% of 12,000 = 3,000 parcels. |
|
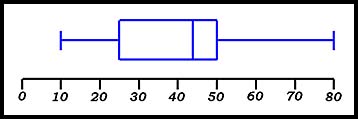
| 12. From the following box-plot, what percentage of observations:
Answer.(i) 25% (ii) 50%. (iii) 75%. (iv) 25%. |
|
| 13. | |
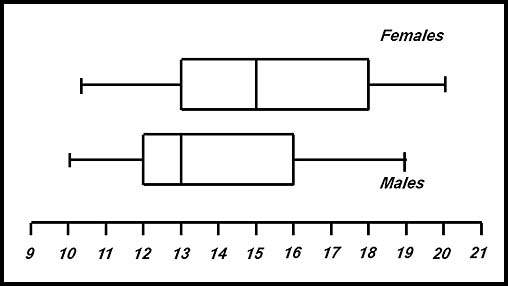
| Interpreting parallel box plots. | 14. 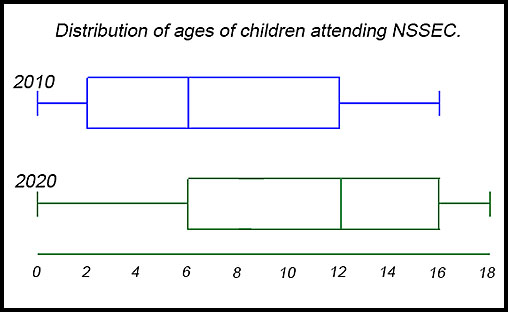
The box and whisker plots above show the distribution of the ages of children attending the NSS Education Centre in 2010 and 2020. In 2010, the centre accommodated 1200 students aged 0 (in the creche) to age 18 (HSC level).
|
| 15. The box plot shown below summaries the waiting time (in minutes) for a group of people who are to receive their first COVID-19 injection.
Answer.(i) 30 males. |
|
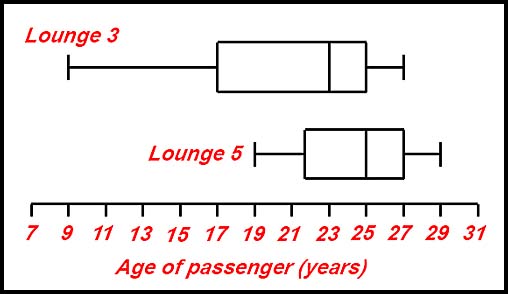
| 16. The box plot below summarises the age of passengers in two airport departure lounges who were taking their first flight.
Luke and Leah both walked around the lounges surveying the passengers. Luke collected information from 80 passengers in Lounge 3 while Leah collected the data from a number of passengers in Lounge 4.
Answer.(i) Aged 29 sitting in Lounge 5. (ii) Aged 9 sitting in Lounge 3. (iii) 20 passengers. (iv) 160 passengers. |
|